Stuffed into a wristband, here’s an Arduino Pro Mini, a LiPo battery and boost converter to get 5V, a couple of LEDs, and the EMF antenna and code. See it glow red AND green when a compact fluorescent light is turned on nearby! Red LED shows 60Hz, green shows “everything else”
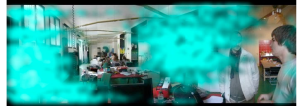
What WiFi looks like to your router
13 JanHere’s another field visualization from a while back. These folks made a directional antenna for WiFi and mapped each network’s intensity as a function of direction. The blue mist shows a WiFi signal coming through a door near the middle of the image, maybe reflecting off the wall on the left. It’s an image-based technique. It won’t tell you the WiFi strength at the red table farther back in the photo, but it can tell you how to point your antenna when you’re standing at the spot where the “image” was collected.
Thanks to Paul Faget for the link.
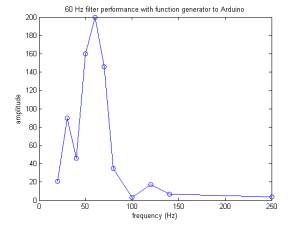
60 Hz digital Arduino filter does the job!
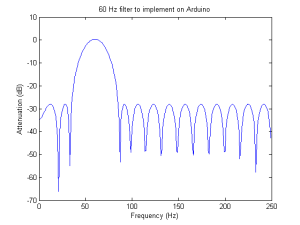
10 JanTo test the digital filter, I removed the EMF sensing resistor and antenna, and then plugged in a 1V peak-to-peak signal from a sine wave generator at different frequencies, up to the maximum frequency of 250 Hz (half the 500 Hz sampling frequency). It gets a little bumpy at low frequency, probably because we’re averaging over a small number of cycles (less than 3).
For a DC input of 5 volts, the Arduino reports an output of 1023. So the filter is working to extract the 1V amplitude, which is 1/5 *1023, or approximately 200. The signal drops to about half the maximum within +/- 15 Hz of 60 Hz. Nice!
I made a version of the EMF sensor that reports the 60Hz voltage as a LED output on pin 11, and “everything BUT 60 Hz” on pin 3, where I put a green LED. The red LED lights near active wires and cords, while the green one goes nuts near compact-fluorescent bulbs (CFL). Two colors will help us distinguish more different kinds of events. To wire it up, just add a 3- to 8 Meg resistor between pin A5 and ground, then stick about a 4 inch wire from pin A5 hanging off into space as in the original EMF detector. The Arduino code is after the jump, and there’s also a list of 50 Hz filter coefficients if you live in one of those regions. You’ll have to truncate those and plug them into your code as we did with the 60 Hz, but you won’t need MATLAB to generate them.
Battereyes are watching you
19 DecEven a battery can be a sensor. I measured the current in a remote control battery while pressing various buttons. The typical remote control dumps a LOT of current through an infrared LED (up to 1A momentarily). The better to reach a TV or DVD player in a far corner of the room. This activity shows up clearly in the battery current.
There are new user activity recognition tools out there that are just a bit bigger than a battery and add an accelerometer. Green Goose (whose sensor kit will be available in January) and Twine (which recently succeeded on Kickstarter–you can back them until January 3) are two. Software and the user interface are going to determine how useful these tools are. Today’s example shows there is plenty of information just from monitoring the battery’s current in an existing gadget.
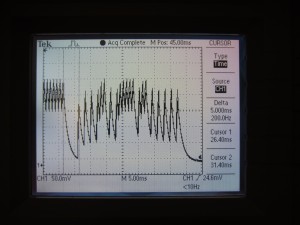
With the remote, there is always a startup pattern in the battery current that probably is a manufacturer’s code, then a 4ms space, then a bunch of shark-fin shapes that vary depending on what button was pushed. Filter capacitors in nearly all gadgets store some power locally, preventing a blackout when there’s activity elsewhere in the circuit. These capacitors distort the battery signal level a lot–making shark fins from square waves–but they don’t change the timing between signal edges. You can definitely see a distinct timing pattern in the digits “o” through “9.”Tips of the fins are separated by either 1ms or 2ms. Here’s a screenshot of the variable part of the signal from pressing the button “5”
Assuming the 2ms corresponds to “1” and the 1ms corresponds to a “o” , there are 20 data bits here. There are 4 bits that stay constant (1110), then 4 data bits (varies), four constant bits (1111), 4 bits that are the inverse of the data bits, and finally a constant (1111). Here are the data bits I found. Interestingly they don’t correspond to binary values for the button number. Anyone with a relevant datasheet might be able to check on this, it’s a Samsung Blu-ray remote circa 2008.
Button 0    1101
Button 1    0100
Button 2    1100
Button 3    0010
Button 4    1010
Button 5    0110
Button 6    0001
Button 7    1110
Button 8    1001
Button 9    0101
In short, your basic alkaline battery knows exactly what you’re doing, watching, and thinking. You may need to get out more. You can even zoom in see the 38 KHz infrared modulation that’s used to reduce sensitivity to ambient light. Read further for more on what is going on and how to do this on your own remote…
Visualizing 2.4 GHz with long exposure photography
14 DecHere’s a nice visualization from Greg Charvat at MIT using a LED-equipped sensor to map out 2.4 GHz waves. The sensor detects the direction as well as magnitude, so you get two different colors. The 2.4 GHz frequency is used for Bluetooth, wireless sensors (especially ZigBee), Wi-Fi and almost every other gadget, if you’re in the US.
Its wavelength is a few centimeters. (In comparision, the wavelength of 60 Hz electromagnetic radiation is a few thousand MILES)
Now you can almost feel the positive and negative wavefronts thanks to this long exposure image, created by moving the sensing antenna around while the LED lights up.
60 Hz EMF filter implemented on Arduino
11 DecNow the digital 60 Hz filter is up and running on the Arduino. The goal was to take in all frequencies of EMF, reject anything that was not 60 Hz, and show the amplitude of the 60 Hz component. Here’s a graph of what the Arduino is doing–producing the green filtered signal from the blue raw signal. It also does a moving average over three cycles so there is a bit of lag, about 0.05 seconds. Thanks to Chris Isert for getting the Arduino interrupts set up so we could control the sampling rate (500 Hz).
It’s very sensitive to whether the antenna is being touched–higher values are when it is touched, then it drops off when not touched as shown about halfway through the graph. But if the user is also touching ground while touching the antenna, the values drop to nearly zero.
There should really be a lowpass RC filter on the EMF detector so that the filter does not get fooled by high frequency harmonics above half the sampling frequency. This may be why the green signal is a little bit higher than the tips of the blue peaks.
Here’s the Arduino code, and more information about what the filter is doing to the signal…
Fields around the power cords
11 DecHere is a composite image where the EMF detector (hanging out on the left) was moved around a power strip that was turned on. Red dots show where the LED went on. This is the original EMF detector, no frequency filtering, but the signal is likely to be mostly 60 Hz based on what we have measured lately. Thanks to Anand Kulkarni for moving the sensor all over the place, and Dr. Karla Welch for making the composite image.
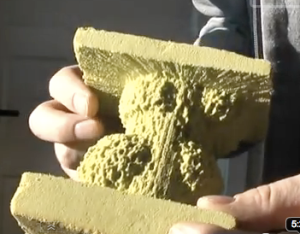
Another 3-D field visualization, this time with carving
6 DecMagnetic fields are another three-dimensional field that you can represent using a threshold. Instead of using a lighted LED as a threshold, as in the RFID visualization, how about carving out a solid representation of the field?
(Thanks to Dan Bowen for the link!)
Number Crunching
14 NovWe want to process the electromagnetic field (EMF) data in real time to determine if it’s 60 Hz or maybe in another frequency range. Wow, having different colors to indicate the type of EMF around an appliance, that would be very interesting! But before getting carried away, there is some number crunching to do.
We could do an analog filter so the Arduino would not have any calculations do. That’s elegant but harder to modify later on, and it adds components. Same for adding a DSP (digital signal processing) chip.
Another way to do this is the Fourier transform to tell us what amplitude EMF we have at what frequency. Even the discrete “fast Fourier transform,” designed specifically for computers, involves floating-point multiplication and calculating sines and cosines. The FFT saves some work by keeping results in a lookup table but still. There are plenty of other things the Arduino needs to do, and these calculations will probably slow down the maximum sampling rate.
We could do a variant called the Goertzel algorithm that computes the amplitude at just one frequency. Here’s a good implementation of the Goertzel algorithm:
Goertzel algorithm from mstarlabs
Still a lot of number crunching. Would a result every two seconds be too slow for us? Maybe there is a more continuous way to apply this algorithm.
Alternatively, there’s digitally filtering out everything but the 60 Hz, then finding the amplitude of that filtered signal. Here’s a very good implementation of a digital 60 Hz bandpass filter. The application is getting a robot to locate a power plug by “feeling” the 60 Hz electric field. The best thing is that the algorithm was run on an ATmega 168 and was able to update about 50 times per second!
Here is my version of this bandpass filter:
It was generated using the following MATLAB code…
Tracking EM fields
9 NovSince last time, we have been working on visualizing the EMF sensor data. Here’s a video with the Arduino EMF sensor “scanning” a microwave oven:
We analyzed the video using a MATLAB program to track the coordinates of the largest red object, then drew a red square over the LED. This kind of tracing will help us create a still image of the fields surrounding an appliance.
Here is the Matlab m-file used to generate the two videos from an original .avi file that had about 4x higher frame rate than was really necessary to track the led… Continue reading
